Microsoft Fabric: All Data Jobs in One Platform
An umbrella on top of Microsoft's three main Data Analytics products: Power BI, Azure Data Factory, and Azure Synapse.
Whether you are a Data Analyst, Data Scientist, Data Engineer, Cloud Engineer Business Analyst or Business Owner, you might have wondered at some point if all of the workflows of all data-related professionals could be unified into a single experience where everyone from tech-savvy Data Scientists, Data Engineers or Analysts and not so tech-savvy business people could easily work with.
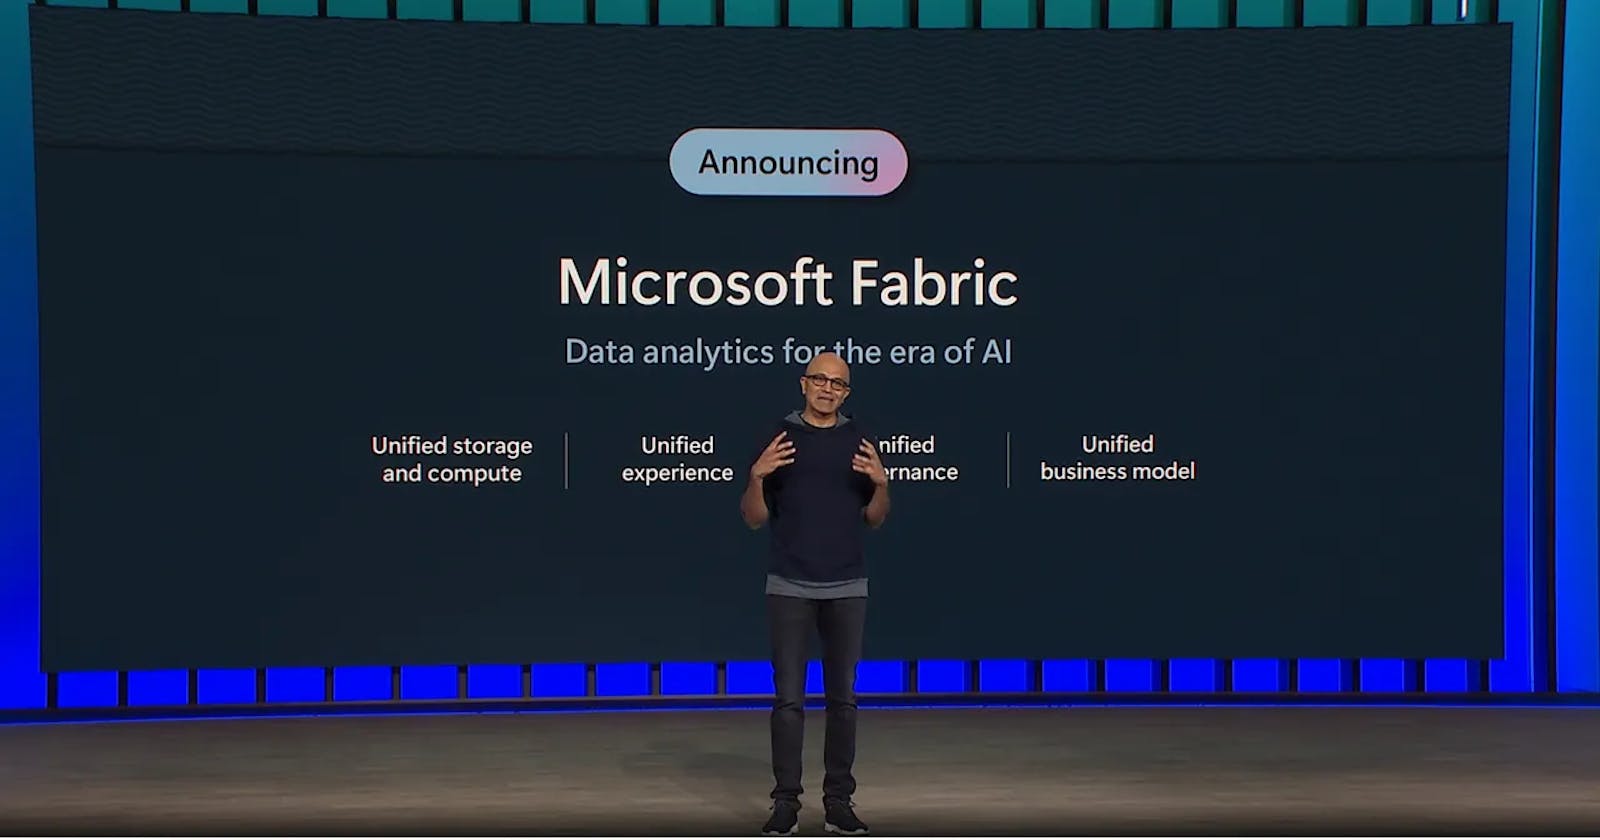
Tech giant Microsoft has worked on that problem and has come up with its solution: Microsoft Fabric which they are referring to as "an end-to-end analytics solution with full-service capabilities including data movement, data lakes, data engineering, data integration, data science, real-time analytics, and business intelligence—all backed by a shared platform providing robust data security, governance, and compliance."
Microsoft Fabric not only combines different features from Power BI, Azure Synapse, Azure Data Explorer but also brings a lot more useful features to the table. For example, there is also an AI-powered Copilot feature to boost productivity. The copilot can write queries, notebook codes and create visualization with simple commands
Components of Microsoft Fabric
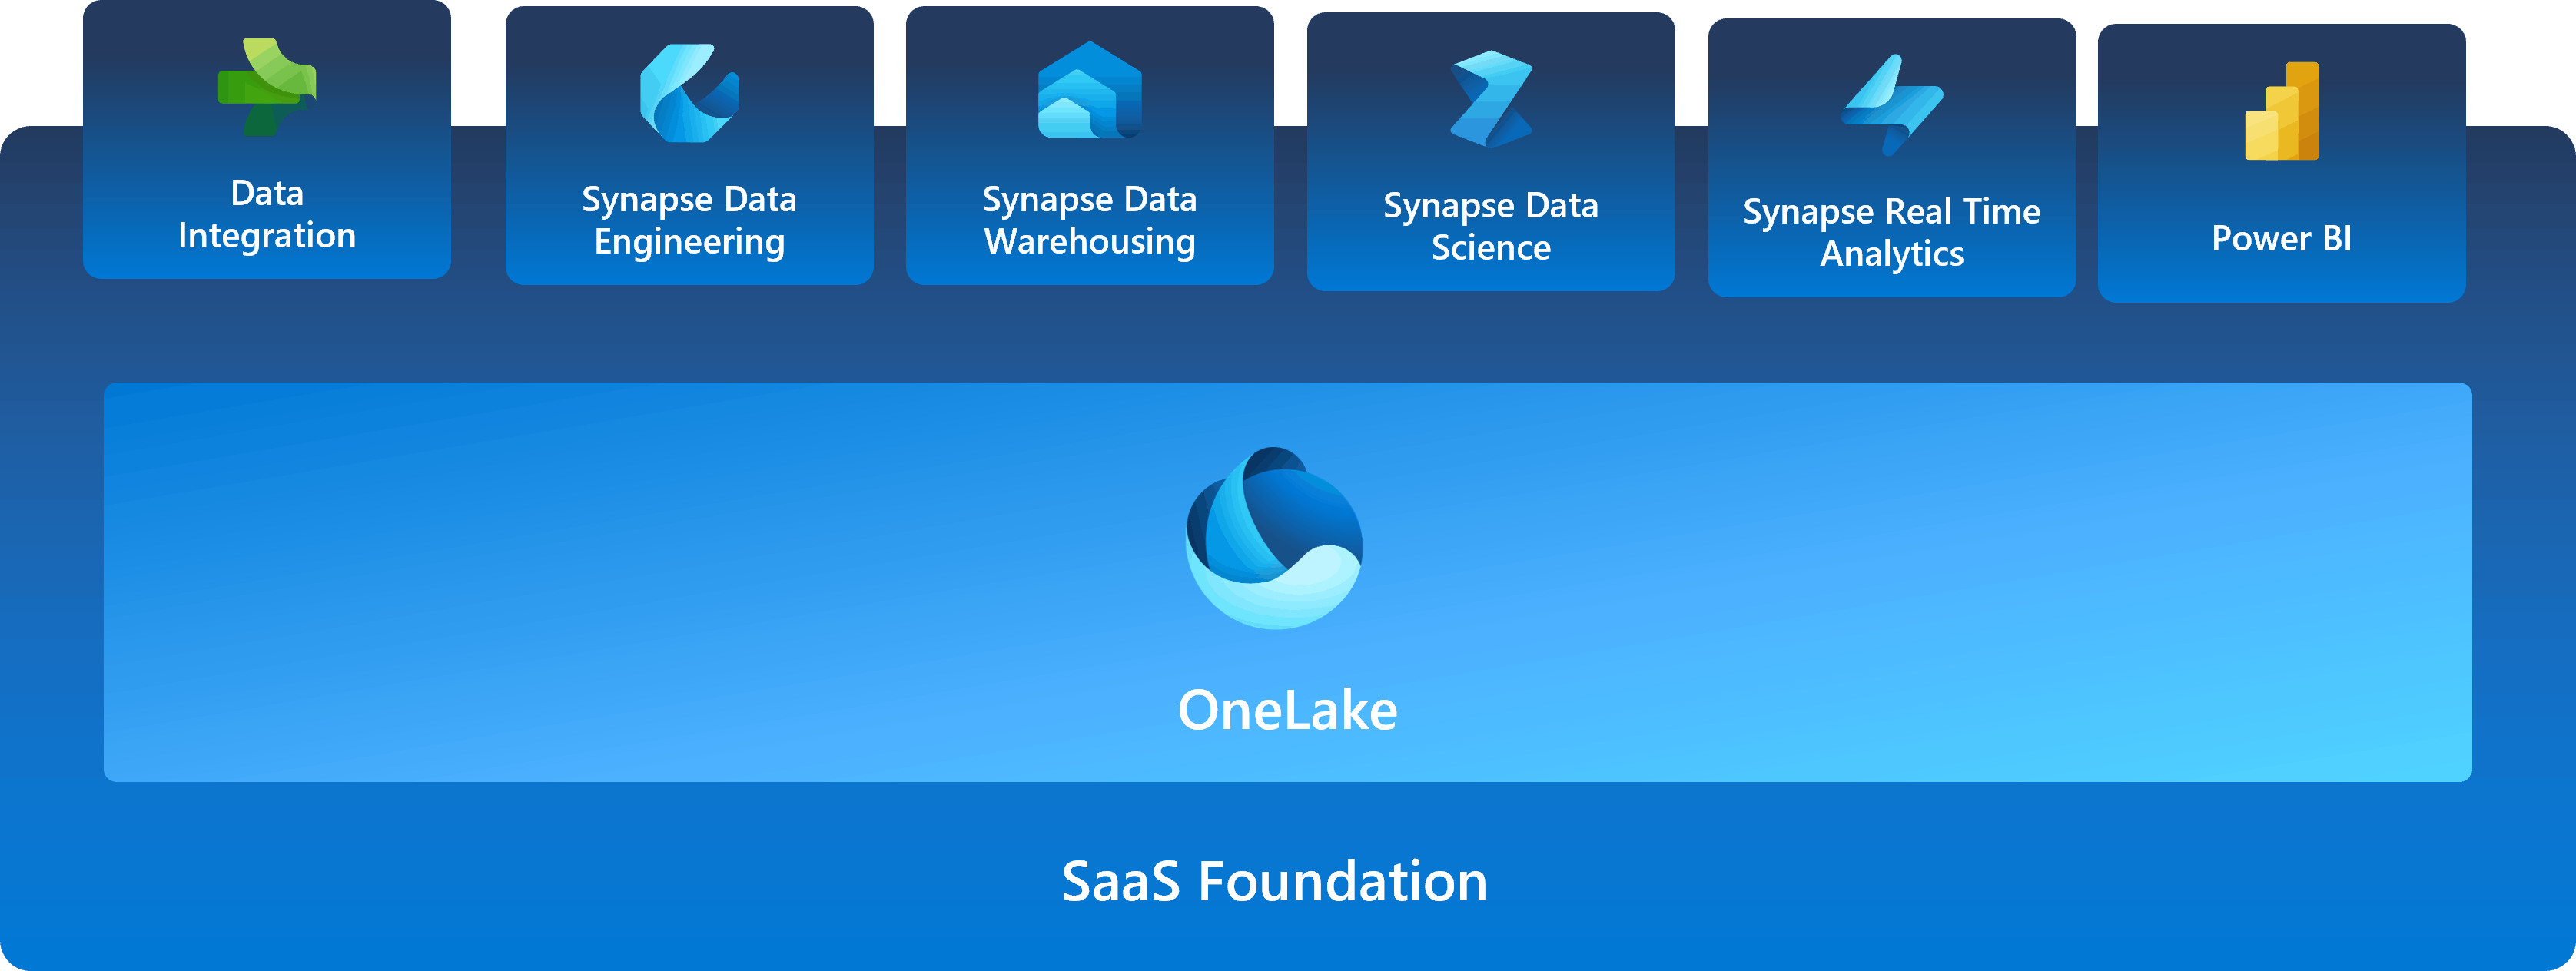
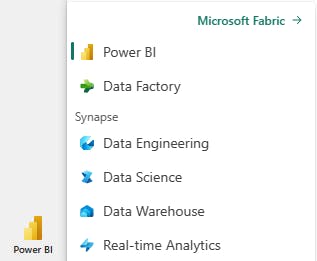
6 key components of Microsoft Fabric for different professionals and use cases:
Data Engineering
Data Factory
Data Science
Data Warehouse
Real-time Analytics
PowerBI
Let's go through them one by one to explore what they are offering:
(1) Data Engineering
Lakehouse: You can store and manage both structured and unstructured data in a single location with built-in data analysis capabilities SQL-based queries, machine learning and other advanced analytics techniques with Lakehouse.
Notebook: Notebook lets you write code in similar environments as Jupyter Notebook in Python, R, and Scala. Notebooks can be used for data ingestion, preparation, analysis, and other data-related tasks.
Spark job Definition: You can use Spark Job Definitions to run batch or streaming jobs on the Apache Spark cluster. These jobs help you transform your data stored in a Lakehouse along with many other functions.
Data pipeline: Data pipelines are a set of actions that help collect, process and convert raw data into a format that can be used for analysis and decision-making. They are important in data engineering as they allow data to be transferred from its source to destination efficiently, reliably and at scale.
(2) Data Factory
2 high-level features are implemented in Data Factory:
Dataflows: Dataflows provide a low-code interface for ingesting data from hundreds of data sources, transforming your data using 300+ data transformations. You can then load the resulting data into multiple destinations, such as Azure SQL databases and more. Dataflows can be run repeatedly using manual or scheduled refreshes, or as part of a data pipeline orchestration.
Data Pipelines: Data pipelines enable powerful workflow capabilities at a cloud scale. With data pipelines, you can build complex workflows that can refresh your data flow, move PetaByte-size data, and define sophisticated control flow pipelines.
(3) Data Science
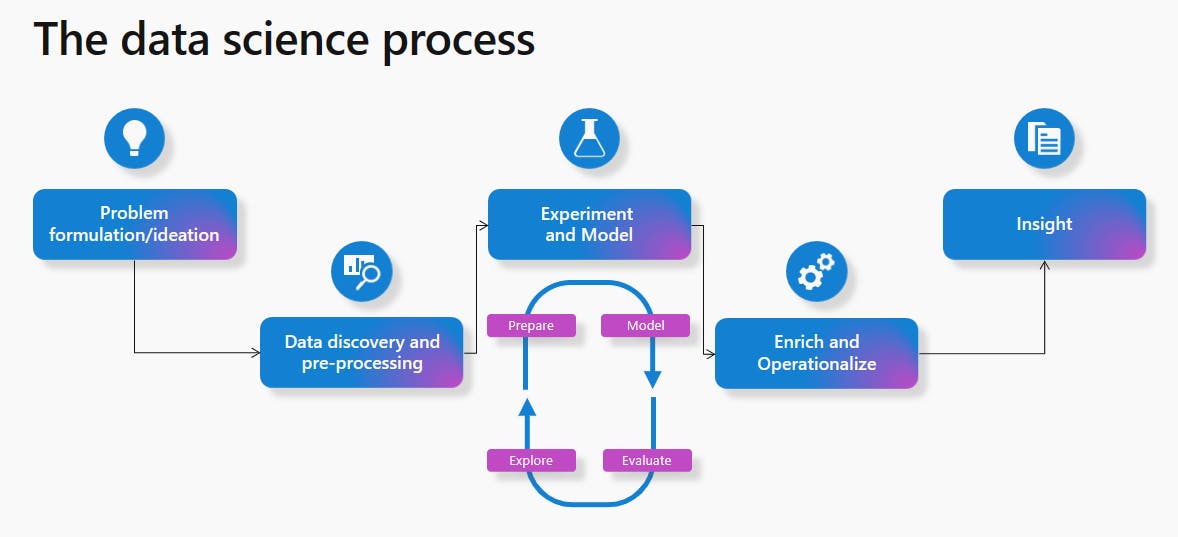
Microsoft Fabric offers Data Science experiences to empower you to complete end-to-end data science workflows. You can complete the entire data science process, from data exploration, preparation and cleansing to experimentation, modeling, model scoring and serving of predictive insights to BI reports.
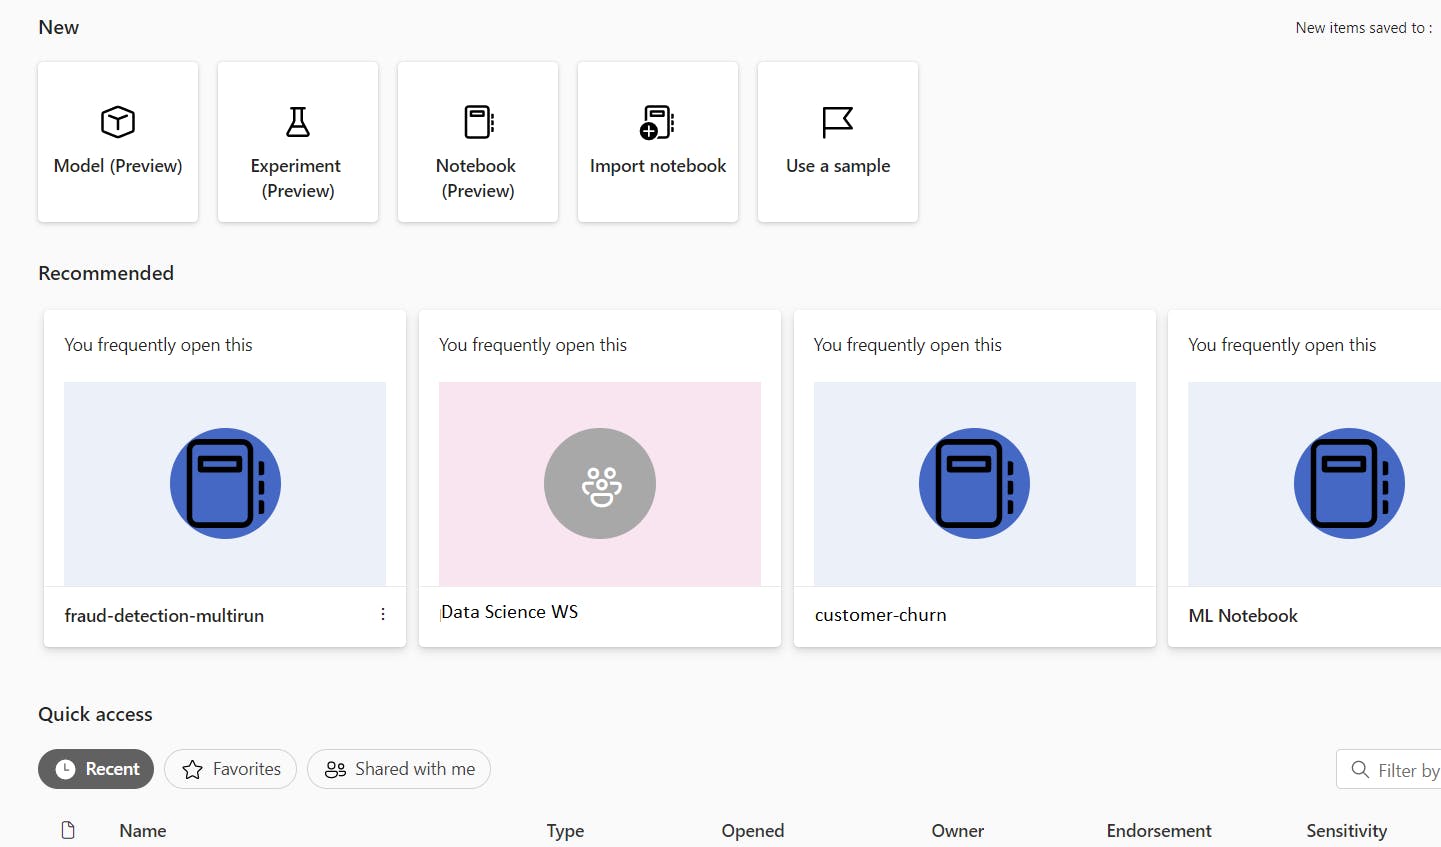
You can access a Data Science Home page. From there, you can discover and access various relevant resources. For example, you can create machine-learning Experiments, Models and Notebooks. you can also import existing Notebooks on the Data Science Home page.
(4) Data Warehouse
Data Warehouse experience provides industry-leading SQL performance and scale. It fully separates compute from storage, enabling independent scaling of both of the components. Additionally, it natively stores data in the open Delta Lake format.
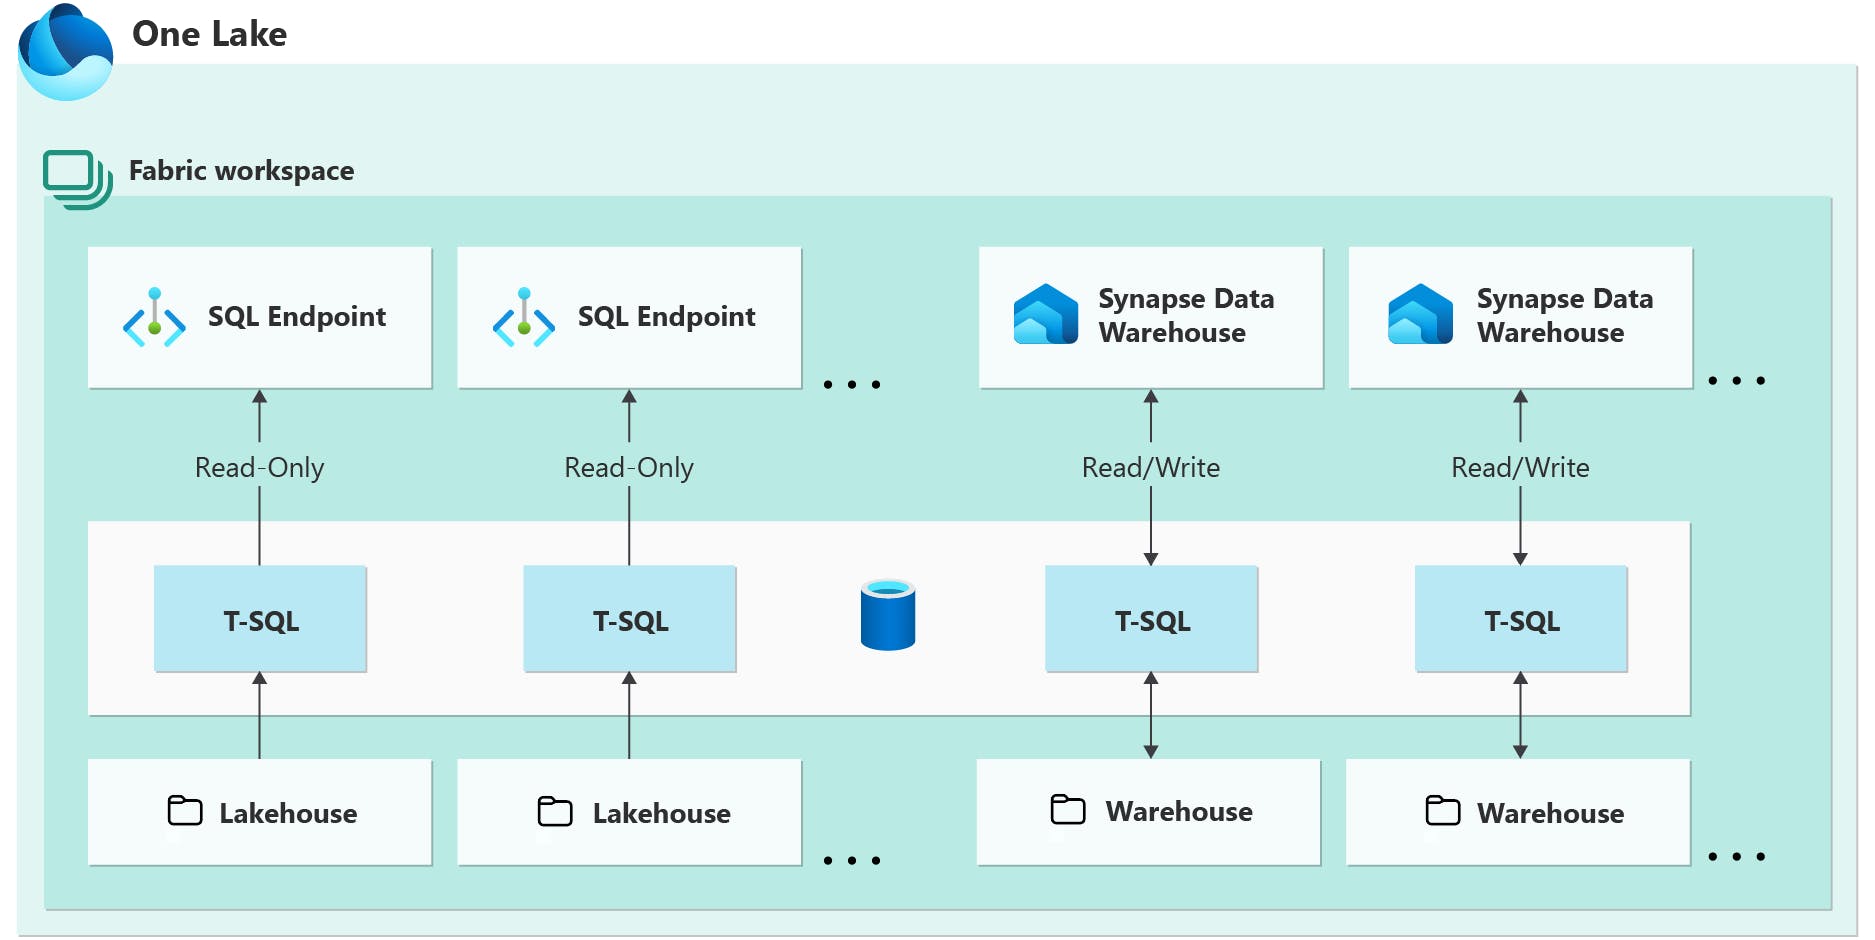
The SQL Endpoint is a read-only warehouse that is automatically generated upon creation from a Lakehouse in Microsoft Fabric. Delta tables that are created through Spark in a Lakehouse are automatically discoverable in the SQL Endpoint as tables. The SQL Endpoint enables you to build a relational layer on top of physical data in the Lakehouse and expose it to analysis and reporting tools using the SQL connection string.
The Synapse Data Warehouse or Warehouse is a 'traditional' data warehouse and supports the full transactional T-SQL capabilities like an enterprise data warehouse. You are fully in control of creating tables, loading, transforming, and querying your data in the data warehouse using either the Microsoft Fabric portal or T-SQL commands.
(5) Realtime Analytics
The main items available in Real-Time Analytics include:
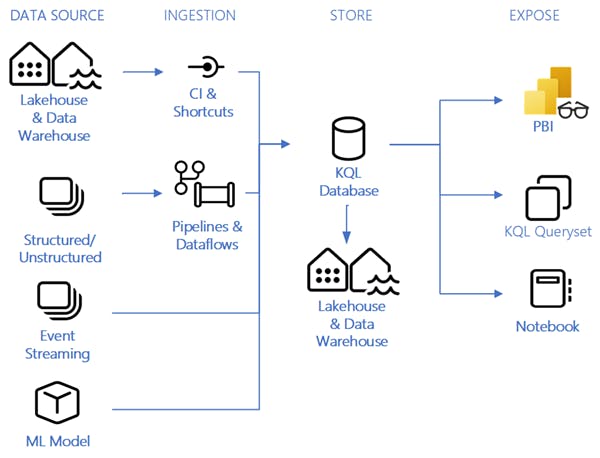
Eventstream: You can capture, transform, and route real-time events to various destinations with a no-code experience.
KQL database: You may use it for data storage and management. Data loaded into a KQL database can be accessed in OneLake and is exposed to other Fabric experiences.
KQL queryset: You can run queries, view, and customize query results on data. The KQL queryset allows you to save queries for future use, export and share queries with others and includes the option to generate a Power BI report.
(6) PowerBI
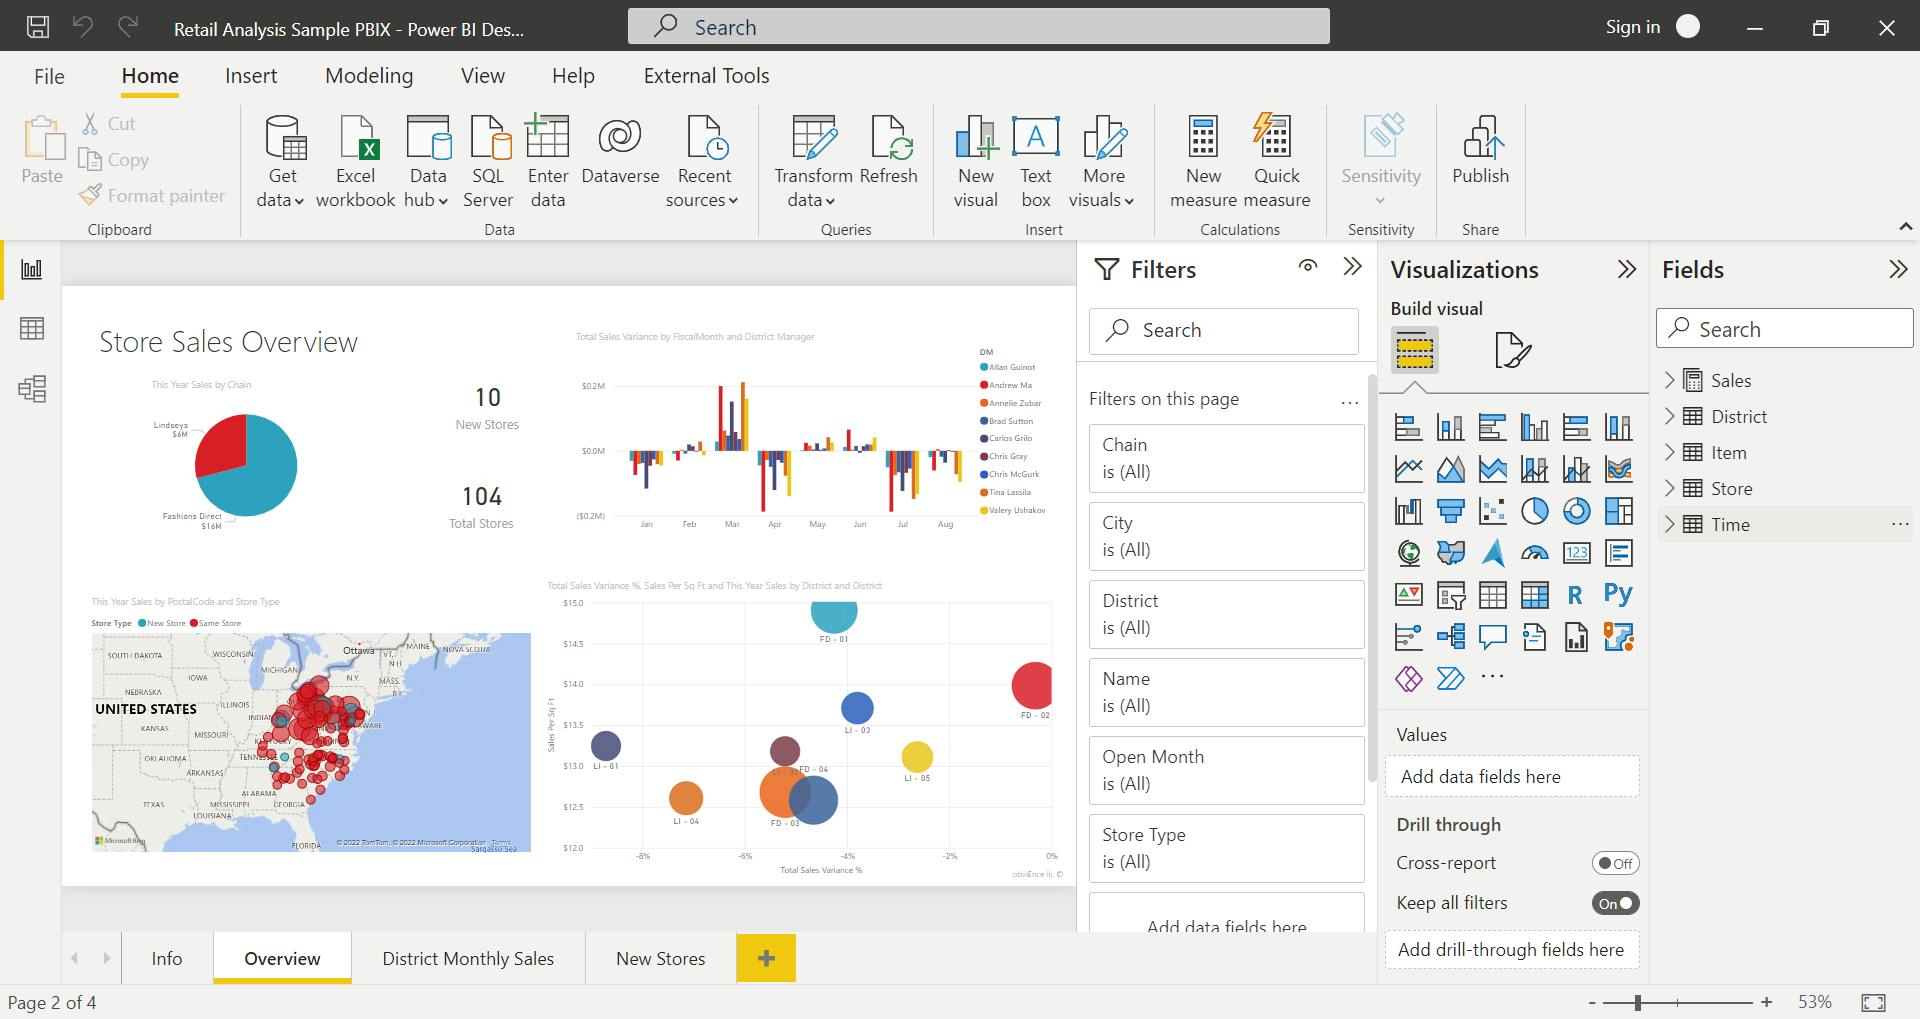
If you haven't heard any of the things we discussed, it is still likely that you have heard of PowerBI, the most used tool for Data Visualization and Business Insights from different sources.
According to Microsoft Learn, Power BI is a collection of software services, apps, and connectors that work together to turn your unrelated sources of data into coherent, visually immersive, and interactive insights. Your data might be an Excel spreadsheet or a collection of cloud-based and on-premises hybrid data warehouses. Power BI lets you easily connect to your data sources, visualize and discover what's important, and share that with anyone or everyone you want.
In short, Microsoft Fabric is the ultimate data analytics platform built on a foundation of Software as a Service (SaaS), which takes simplicity and integration to a whole new level.

